Document Type
Emerging StandardPublished date
06/01/2023Input Close Date
To be determinedScientific Experts
Dom Vicchio (Sr. Director, USP)
Introduction
To jump-start the standard development process and have earlier stakeholder engagement, USP is piloting a new approach for developing and sharing information with our stakeholders. Through a collaboration between USP’s Small Molecules Department and the Global Analytical Development Laboratory, methods will be developed and validated for drug substances and drug products for which no monographs are currently available. The Emerging standards are intended to improve USP’s official standards elaboration process by increasing transparency and allowing for broader stakeholder participation by publishing on the USP website prior to formal notice and comment through publication in the Pharmacopeial Forum.
Varenicline Tablets has been evaluated and shown to be a suitable candidate for development under this new program. The methods, in this document, are being published to help analyze Varenicline Tablets as a part of USP’s mission to improve global health through public standards that help ensure the safety, quality, and benefit of medicines and foods.
Certain commercial equipment, instruments or materials may be identified in this document to specify adequately the experimental procedure. Such identification does not imply approval, endorsement, or certification by USP of a particular brand or product, nor does it imply that the equipment, instrument, or material is necessarily the best available for the purpose or that any other brand or product was judged to be unsatisfactory or inadequate.
This document is not a USP compendial standard and is intended to serve as a resource for informational purposes only. It does not reflect USP or USP’s Expert Body opinions of future revisions to the official text of the USP-NF. Parties relying on the information in this document bear independent responsibility for awareness of, and compliance with, any applicable federal, state, or local laws and requirements.
Background
Varenicline tartrate is in a class of medications called smoking cessation aids. Varenicline is the active ingredient in Varenicline Tablets. It is used to help people stop smoking by blocking the pleasant effects of nicotine (from smoking) by binding with nicotine receptors in the brain1.
The USP-NF does not contain a drug substance or drug product monograph for Varenicline Tartrate. As part of the emerging standards initiative, it was decided to develop methods for Varenicline Tablets starting with the conditions from high-performance liquid chromatography (HPLC) with ultraviolet (UV) methods from a submission for drug substance.
This document describes methods and includes supporting chromatographic system data for peak retention time match and photodiode array (PDA) spectral match, which may be suitable for identifying varenicline in the presence of various impurities and excipients. HPLC methods and supporting validation data, which may be suitable for determining strength and purity, are also described.
Varenicline tartrate and related impurities are shown in Figures 1 and 2.
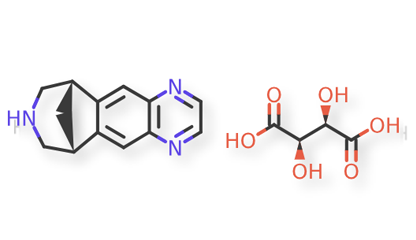
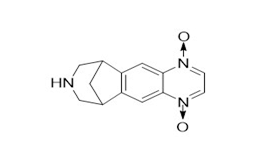
Figure 2a. Varenicline di-N-oxide
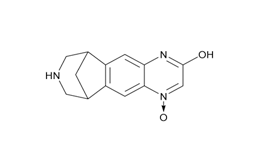
Figure 2b. Hydroxyvarenicline N-oxide
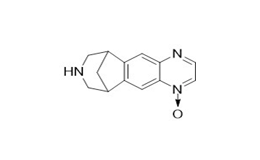
Figure 2c. Varenicline N-oxide
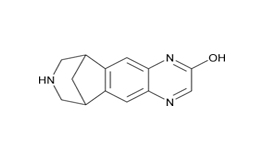
Figure 2d. Hydroxyvarenicline
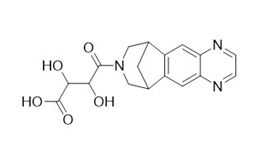
Figure 2e. Varenicline tartaramide
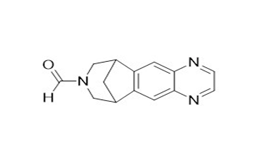
Figure 2f. Varenicline formamide
Figure 2. Varenicline tartrate related impurities
EXPERIMENTAL
Materials:
Varenicline tartrate and related impurities (Varenicline di N-oxide, Hydroxyvarenicline N-oxide, Varenicline N-oxide, Hydroxyvarenicline, Varenicline tartaramide, and N-formyl Varenicline) were procured from commercial sources.
Varenicline Tablets samples with 0.5 mg and 1 mg label claims were procured from commercial sources and were used to evaluate identification by ultraviolet (UV) spectral match and retention time match, assay, and organic impurities using methods described in this document. As a USP reference standard (RS) for varenicline tartrate is not currently available, the Varenicline Tartrate active pharmaceutical ingredient (API) was procured and qualified as a standard.
IDENTIFICATION
Identification of varenicline in Varenicline Tablets was evaluated using HPLC-UV with PDA detector and chromatographic HPLC retention time match.
A. HPLC-UV with PDA Detector:
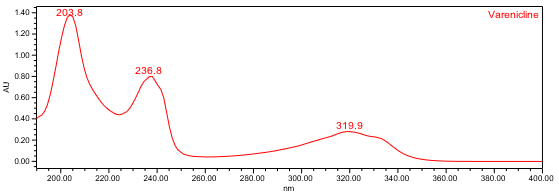
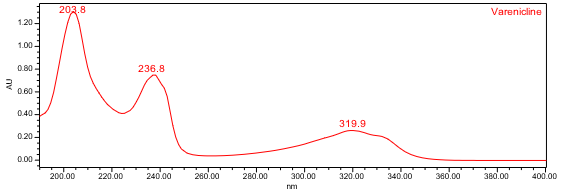
The HPLC assay procedure with PDA detector was used as the chromatographic identification procedure. See the Assay section for the method conditions and solution preparations. The validation parameter and results are summarized in Table 1, and representative UV spectra of the varenicline standard and sample are shown in Figures 3 and 4.
| Parameter | Samples and Procedure | Results |
|---|---|---|
| Spectral Agreement | Collect PDA data from 190-400nm for the Standard solution and Sample solution | The UV spectrum of the varenicline peak from the Sample solution matched the spectrum of varenicline in the Standard solution and exhibited maxima and minima only at the same wavelengths as the Standard solution. |
| Abbreviations- PDA: photodiode array; UV: ultraviolet | ||
B. Retention Time Match:
The chromatographic retention time is used as an identification method. The HPLC assay procedure was utilized for this identification test. Refer to the Assay section for the method conditions and solution preparations.
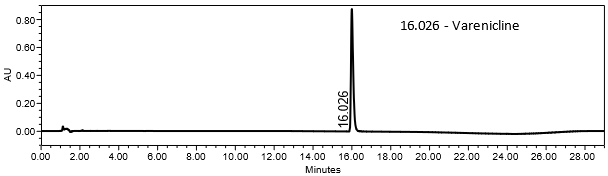
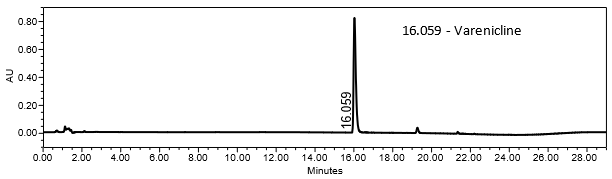
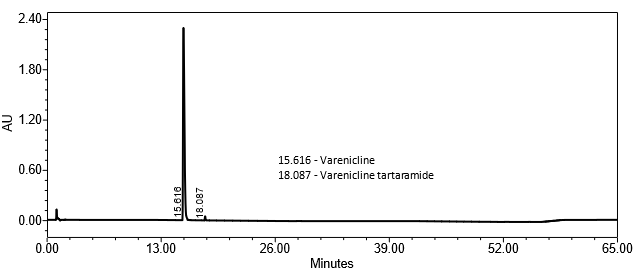
The validation parameter and results are summarized in Table 2, and the example chromatograms for the Standard solution and Sample solution are shown in Figures 5 and 6, respectively.
| Parameter | Samples | Results |
|---|---|---|
| Retention Time Match | Standard solution and sample solution | The relative standard deviation (%RSD) of the varenicline peak retention time for all injections of the Standard solution and Sample solution was <1.0. |
ASSAY
A gradient reversed-phase HPLC procedure was developed for the assay of Varenicline Tablets. The procedure was validated using the criteria described in USP General Chapter <1225> Validation of Compendial Procedures2 and found to be specific, linear, accurate, precise, robust, and free from interference for the samples evaluated.
Chemicals:
Potassium phosphate monobasic (ACS grade), potassium hydroxide (ACS grade), acetonitrile (Optima LC/MS grade), methanol (Optima LC/MS grade), and sodium hydroxide (ACS grade) were obtained from Fisher Chemicals. Ultrapure water was obtained from a Milli-Q water purification system.
Instruments and method:
The analysis of Varenicline Tablets was performed using Waters Alliance 2695 and Agilent 1260 instruments with PDA detector, and the results were processed using Empower (Waters software). The GL Sciences InertSustain AQ-C18, 4.6-mm x 150 mm, 3 µm column was used for analysis. The analysis was performed at 29°C, with a flow rate of 1.3 mL/min and 25 µL as the injection volume. Autosampler temperature was kept at 10°C. The PDA detector was set at 190–400 nm wavelength, and the detection of chromatogram was at 210 nm. The separation was achieved by a gradient program as listed in Table 3.
| Time (min) | Solution A (%) | Solution B (%) |
|---|---|---|
| 0 | 100 | 0 |
| 3 | 98 | 2 |
| 10 | 98 | 2 |
| 17.5 | 79 | 21 |
| 23 | 25 | 75 |
| 25 | 100 | 0 |
| 29 | 100 | 0 |
Solutions:
Buffer: Weigh 6.8 g of potassium phosphate monobasic and dissolve in 1000 mL of water. Filter the solution through a 0.22- µm membrane filter.
50% Potassium hydroxide solution: Dissolve 5.0 g of potassium hydroxide in 10 mL of water.
Solution A: Transfer 475 mL of Buffer, 475 mL of water, and 50 mL of acetonitrile into a 1-L bottle, mix well, and adjust to pH 7.2 with 50% Potassium hydroxide solution.
Solution B: Transfer 400 mL of Buffer and 600 mL of acetonitrile into a 1-L bottle, mix well, and adjust to pH 7.2 with 50% Potassium hydroxide solution.
0.1 N Sodium hydroxide solution: Pipet 10 mL of 10 N sodium hydroxide into 1 L of water and mixed well.
Diluent: Transfer 400 mL of methanol and 600 mL of 0.1 N Sodium hydroxide solution into a 1-L bottle and mix well.
Standard solution: A solution of Varenicline Tartrate standard, equivalent to 0.05 mg/mL of varenicline, was prepared by dissolving an appropriate amount in Diluent.
Sample solution: Nominally 0.05 mg/mL of varenicline from Varenicline Tablets was prepared as follows. Grind NLT 20 Varenicline Tablets to a fine powder. Transfer an accurately weighed portion, equivalent to about 5 mg of varenicline, to a 100-mL volumetric flask. Add 80 mL of Diluent and vortex for at least one minute. Sonicate for NLT 60 min with occasional mixing, dilute to volume with Diluent and mix well. Centrifuge the solution for 10 min at 10000 rpm and use the clear supernatant.
Analytical parameters and validation:
The optimized chromatographic conditions were checked for robustness and validated by evaluating specificity, linearity, precision, and accuracy as described in USP General Chapter <1225>2. The system suitability requirements are summarized in Table 4. The validation parameters, solutions, and results for Varenicline Tablets are summarized in Table 5. The example chromatograms for the Assay Standard solution and Sample solution are shown in Figures 5 and 6, respectively.
| Parameter | Solutions | Results |
|---|---|---|
| Retention time of varenicline | Standard solution | About 16 min |
| Tailing factor | Standard solution | Tailing was NMT 2.0 |
| System Precision (for 5 replicate injections) | Standard solution | %RSD was NMT 0.5 |
| Abbreviation: RSD, Relative standard deviation; NMT, not more than | ||
| Parameter | Solutions | Results |
|---|---|---|
Specificity (Chromatographic Separation) Peak Purity Analysis (Spectral Homogeneity) | Diluent, Standard solution, and Sample solution
| Any peak from the Standard solution and Sample solution was separated from the varenicline peak by a resolution ≥ 2.0. The PDA data from 190–400 nm showed homogeneity of UV spectrum for the varenicline peak, indicating the lack of coelution. |
Linearity
| Linearity solutions from 50% to 150% of the nominal concentration (0.025, 0.038, 0.05, 0.063, and 0.075 mg/mL of varenicline)
| The correlation coefficient (r) was not less than 0.999. The bias of the linearity curve due to the intercept not being zero was less than ±2.0%. |
Accuracy
| Accuracy solutions from 110–130% of the nominal concentration prepared in triplicate: 110% (0.055 mg/mL), n=3 120% (0.06 mg/mL), n=3 130% (0.065 mg/mL), n=3 | The average recovery at each level was within 100 ± 2.0%.
|
Repeatability
| Repeatability solutions: 6 Sample solutions | The %RSD of assay results was NMT 2.0 (n=6).
|
Intermediate Precision
| Intermediate precision was done by a different analyst, on a different day by using a different instrument and different column lot number.
| The %RSD of assay results was NMT 2.0 (n=6). The %RSD of assay results was NMT 3.0 for the combined data of the first and second analysts (n=12). |
| Solution Stability | Standard solution and Sample solution | Standard solution and Sample solution were stable for 24 hours at a sample cooler temperature of 10°C. |
| Sample Assay Test | Sample solution | 93.3% (for 0.5 mg Varenicline Tablets) and 100.1% (for 1 mg Varenicline Tablets) for the one source of the drug product tested. |
ORGANIC IMPURITIES
The HPLC method used for the analysis of the organic impurities is the same procedure described in the Assay section, except for the gradient program summarized in Table 6. The method can be used to quantitate degradants in Varenicline Tablets. The procedure was validated using the criteria described in USP General Chapter <1225>2 and found to be specific, accurate, precise, robust, linear, and free from interference for the samples evaluated. The validation study showed that the method was suitable for the evaluation of the organic impurities in Varenicline drug product.
| Time (min) | Solution A (%) | Solution B (%) |
|---|---|---|
| 0 | 100 | 0 |
| 3 | 98 | 2 |
| 10 | 98 | 2 |
| 25 | 60 | 40 |
| 40 | 60 | 40 |
| 50 | 25 | 75 |
| 55 | 25 | 75 |
| 56 | 100 | 0 |
| 65 | 100 | 0 |
Solutions:
Buffer, 50% Potassium hydroxide solution, Solution A, Solution B, 0.1 N Sodium hydroxide solution, Diluent, and chromatographic conditions were prepared and followed as per the Assay procedure.
Preparation of System suitability stock solution: A solution consisting of 0.2 mg/mL of varenicline tartaramide was prepared by dissolving an appropriate amount of varenicline tartaramide in Diluent.
Preparation of System Suitability solution: A solution consisting of 0.2 mg/mL of varenicline and 0.002 mg/mL of varenicline tartaramide was prepared by combining an appropriate amount of Varenicline Tartrate with the appropriate volume of the System suitability stock solution in Diluent.
Preparation of Sensitivity stock solution-1: A solution consisting of 0.1 mg/mL each of varenicline di N-oxide, hydroxyvarenicline N-oxide, varenicline N-oxide, hydroxyvarenicline, varenicline tartaramide, N-formyl varenicline, and varenicline (equivalent to 0.17 mg/mL of Varenicline Tartrate) was prepared by dissolving the appropriate amounts of each impurity and Varenicline Tartrate in Diluent with the aid of sonication.
Preparation of Sensitivity stock solution-2: A solution containing 4.0 μg/mL each of varenicline di N-oxide, hydroxyvarenicline N-oxide, varenicline N-oxide, hydroxyvarenicline, varenicline tartaramide, N-formyl varenicline, and varenicline (equivalent to 6.8 μg/mL of Varenicline Tartrate) was prepared from Sensitivity stock solution-1 by further diluting with the Diluent.
Preparation of Sensitivity solution: A solution containing 0.2 μg/mL (0.1%) each of varenicline di N-oxide, hydroxyvarenicline N-oxide, varenicline N-oxide, hydroxyvarenicline, varenicline tartaramide, N-formyl varenicline, and varenicline (equivalent to 0.34 μg/mL of Varenicline Tartrate) was prepared from Sensitivity stock solution-2 by further diluting with the Diluent.
Preparation of Standard stock solution: A solution of Varenicline Tartrate standard, equivalent to 0.1 mg/mL of varenicline, was prepared by dissolving an appropriate amount in Diluent.
Preparation of Standard solution: A solution of Varenicline Tartrate standard, equivalent to 1.0 μg/mL of varenicline (0.5% of the sample concentration), was prepared from Standard stock solution by further diluting with the Diluent.
Preparation of Sample solution: Nominally 0.2 mg/mL of varenicline from Varenicline Tablets was prepared as follows. Grind NLT 20 Varenicline Tablets to a fine powder. Transfer an accurately weighed portion, equivalent to about 2 mg of varenicline, to a 10-mL volumetric flask. Add 8 mL of Diluent and vortex for at least one minute. Sonicate for NLT 60 min with occasional mixing, dilute to volume with Diluent and mix well. Centrifuge the solution for 10 min at 10000 rpm and use the clear supernatant.
Analytical parameters and validation:
The optimized chromatographic conditions were checked for robustness and validated by evaluating specificity, linearity, accuracy, repeatability, intermediate precision, and sample analysis as described in USP General Chapter <1225>2. Linearity was established for varenicline and related impurities, whereas accuracy and repeatability were established for varenicline-related impurities.
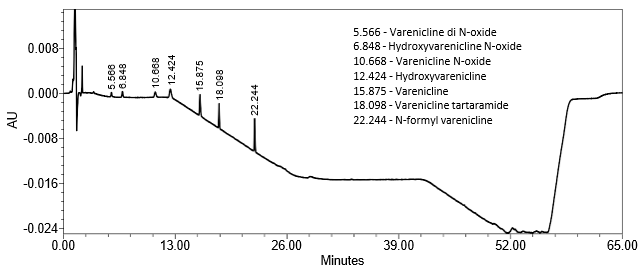
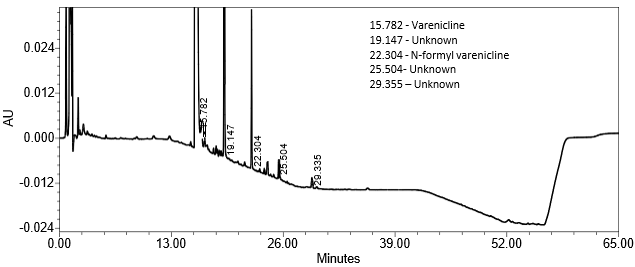
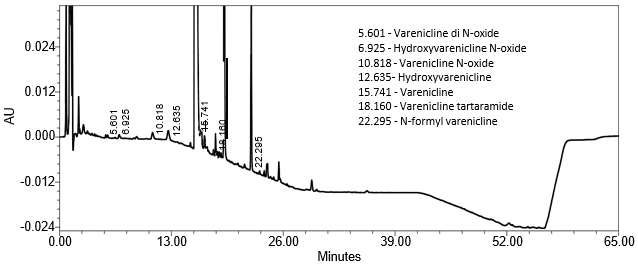
The limit of quantitation (LOQ) was established at 0.10% of sample concentration. The system suitability requirements are summarized in Table 7. The validation parameters and testing results are summarized in Table 8. The example chromatograms of Diluent, System suitability solution, Sensitivity solution, Sample solution, and Sample solution with spiked impurities (LOQ level) are presented in Figures 7–11, respectively.
| Parameter | Solution | Results |
|---|---|---|
Resolution Minimum resolution between varenicline and varenicline tartaramide | System suitability solution |
11.4 (See Figure 8) |
Retention Time Varenicline | Sensitivity solution |
15.9 min |
Relative Retention Time Varenicline di N-oxide Hydroxyvarenicline N-oxide Varenicline N-oxide Hydroxyvarenicline Varenicline Varenicline tartaramide N-formyl varenicline | Sensitivity solution |
0.35 0.43 0.67 0.78 1.00 1.14 1.40 (See Figure 9) |
System Precision (%RSD of 6 replicate injections) Varenicline di N-oxide Hydroxyvarenicline N-oxide Varenicline N-oxide Hydroxyvarenicline Varenicline Varenicline tartaramide N-formyl varenicline | Sensitivity solution |
3.6 1.1 1.9 1.7 0.3 0.2 0.3 |
USP Signal-to-Noise Ratio Varenicline di N-oxide Hydroxyvarenicline N-oxide Varenicline N-oxide Hydroxyvarenicline Varenicline Varenicline tartaramide N-formyl varenicline | Sensitivity solution |
56 79 67 119 297 348 463 |
| Parameter | Solutions | Results |
|---|---|---|
| Specificity | Blank (Diluent), System suitability solution, Sensitivity solution, Sample solution, and spiked Sample solution | No interference with peaks of interest. Any peak ≥0.1% total area was separated from the main peak by a resolution of ≥2.0, and from adjacent specified impurity peaks by a resolution of ≥1.5. |
LOQ (0.10%) Varenicline di N-oxide Hydroxyvarenicline N-oxide Varenicline N-oxide Hydroxyvarenicline Varenicline Varenicline tartaramide N-formyl varenicline | Sensitivity solution and accuracy solution spiked with impurities at the LOQ level. Experimentally determined using signal-to-noise values, and meeting accuracy, and repeatability criteria at that concentration | All concentration values met a signal-to-noise criterion of ≥ 10 (refer to Table 7). See below for accuracy and repeatability. |
Linearity Varenicline di N-oxide Hydroxyvarenicline N-oxide Varenicline N-oxide Hydroxyvarenicline Varenicline Varenicline tartaramide N-formyl varenicline | Linearity solutions From LOQ (0.10%) to 1.0% of the nominal concentration of varenicline | The correlation coefficients of the linear curves for varenicline and the impurities were not less than 0.99. |
| Relative Response Factor (RRF) Values | Linearity solutions From LOQ (0.10%) to 1.0% of the nominal concentration of varenicline | For results, see Table 9. |
Accuracy Varenicline di N-oxide Hydroxyvarenicline N-oxide Varenicline N-oxide Hydroxyvarenicline Varenicline tartaramide N-formyl varenicline | Accuracy solutions: impurities spiked in Sample solution at 3 levels: LOQ (0.10%): n=6 0.50%: n=3 1.0%: n=3 | The average recovery for each specified impurity at each level were observed to be within: 0.10%: 100 ± 20.0% 0.50%: 100 ±10.0% 1.0%: 100 ± 5.0% |
Repeatability Varenicline di N-oxide Hydroxyvarenicline N-oxide Varenicline N-oxide Hydroxyvarenicline Varenicline tartaramide N-formyl varenicline | Repeatability solutions: 6 spiked Sample solutions at the LOQ level | The %RSD of the recovery was ≤ 10.0 (n=6). See Figure 11 for example chromatogram. |
Intermediate Precision Varenicline di N-oxide Hydroxyvarenicline N-oxide Varenicline N-oxide Hydroxyvarenicline Varenicline tartaramide N-formyl varenicline | Repeatability solutions: 6 spiked Sample solutions at the LOQ level, prepared and evaluated by a different analyst on a different day, using a different instrument and different column serial number | The average recovery at LOQ was within 100 ± 20.0% (for second analyst) %RSD of the 6 results at LOQ was ≤ 10.0 (for second analyst). %RSD of the 12 results at LOQ from both analysts was ≤ 15.0. |
| Sample Analysis | Sample solution | See Figure 10. |
Solution Stability Varenicline di N-oxide Hydroxyvarenicline N-oxide Varenicline N-oxide Hydroxyvarenicline Varenicline Varenicline tartaramide N-formyl varenicline | Sensitivity solution and spiked Sample solution at LOQ level. Freshly prepared samples analyzed (t=0). The samples were then stored at 10°C and analyzed periodically for up to 48 hours. | Observed changes in the peak area for each impurity and varenicline from both solutions were within ± 10% of the initial values. |
| Impurity Name | RRF |
|---|---|
| Varenicline di N-oxide | 0.16 |
| Hydroxyvarenicline N-oxide | 0.28 |
| Varenicline N-oxide | 0.39 |
| Hydroxyvarenicline | 0.77 |
| Varenicline tartaramide | 0.77 |
| N-formyl varenicline | 1.12 |
| Varenicline | 1.00 |
| RRF values of the impurities were calculated by dividing the slope of the linearity curve for each impurity by the slope of the linearity curve for varenicline. | |
Comment Not Found