Document Type
Emerging StandardPublished date
03/24/2024Input Close Date
To be determinedScientific Experts
Dom Vicchio (Sr. Director, USP)
1. Introduction
To jump-start the standard development process and have earlier stakeholder engagement, USP is piloting a new approach for developing and sharing information with our stakeholders. Through a collaboration between USP’s Small Molecules Department and Global Analytical Development Laboratory, methods are being developed and validated for drug substances and drug products for which no monographs are currently available. The Emerging Standards are intended to improve USP’s official standards elaboration process by increasing transparency and allowing for broader stakeholder participation by publishing on the USP website prior to formal notice and comment through publication in the Pharmacopeial Forum.
Guaifenesin Extended-Release Tablets has been evaluated and shown to be a suitable candidate for development under this new program. The methods, in this document, are being published to help analyze Guaifenesin Extended-Release Tablets. Additional method development and validation information is provided to justify the use of method parameters.
Certain commercial software, instruments, or material may be identified in this document to specify adequately the experimental procedure. Such identification does not imply approval, endorsement, or certification by USP of a particular brand or product, nor does it imply that the software, instrument, or material is necessarily the best available for the purpose or that any other brand or product was judged to be unsatisfactory or inadequate.
This document is not a USP compendial standard and is intended to serve as a resource for informational purposes only. It does not reflect USP or USP’s Expert Body opinions of future revisions to the official text of the USP-NF. Parties relying on the information in this document bear independent responsibility for awareness of, and compliance with, any applicable federal, state, or local laws and requirements.
2. Background
Guaifenesin is in a class of medications called expectorants. It works by thinning the mucus in the air passages to make it easier to cough up the mucus and clear the airways1. Guaifenesin is the active ingredient in Guaifenesin Extended-Release Tablets.
The USP-NF contains a monograph for guaifenesin drug substance2 and several monographs for drug products including Guaifenesin Tablets3, Guaifenesin Capsules4, Guaifenesin Oral Solution5, Guaifenesin for Injection6, and Guaifenesin Compounded Injection, Veterinary7. However, there is no monograph for Guaifenesin Extended-Release Tablets. As part of the Emerging Standards initiative, it was decided to develop methods for Guaifenesin Extended-Release Tablets.
The recently published USP General Chapter <1220>8 provides a framework for the implementation of the analytical procedure life cycle approach that is consistent with the quality by design (QbD) concepts described in the ICH guidelines. Stage 1 of the life cycle includes systematic procedure development experiments that result in an understanding of the effect of procedure parameters on procedure performance. Design of Experiment (DOE) which includes statistical multi-variate analysis and modeling is an important tool in Stage 1. The knowledge acquired through DOE studies also enables the determination of robust operation regions for procedure parameters and, if desired, a method operable design region (MODR).
This document summarizes method development efforts assisted by the Fusion QbD® software, as well as robustness and forced degradation study results. It also describes the final procedures that may be suitable for the identification, and the strength and purity determination of guaifenesin in the presence of various impurities and excipients in Guaifenesin Extended-Release Tablets. Summary of validation data and representative chromatographic results are included.
3. Materials
3.1. Guaifenesin and Impurities Standards
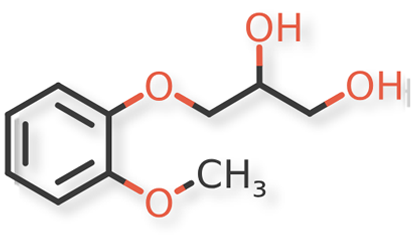
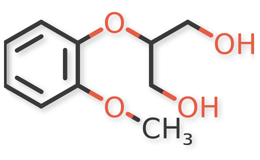
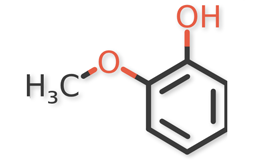
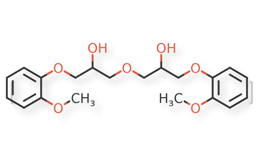
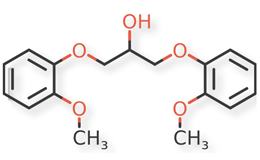
USP Guaifenesin RS, USP Isoguaifenesin RS, and USP Guaiacol RS, were used. Guaifenesin dimer and dianisylglycerol were procured from another supplier. Chemical structures of guaifenesin and related impurities are shown in Figures 1 and 2.
3.2. Samples
Four Guaifenesin Extended-Release Tablet formulations from four different commercial sources were used to evaluate methods described in this document.
3.3. Reagents
Glacial acetic acid (ACS grade), acetonitrile (HPLC grade), and methanol (HPLC grade) were obtained from Fisher Chemical. Ultrapure water was obtained from a Milli-Q water purification system.
4. Method Development
The goal was to develop a stability-indicating Organic Impurities (OI) method for all known impurities and other potential degradants for Guaifenesin Extended-Release Tablets, using the high-performance liquid chromatograph (HPLC) conditions from the OI procedure of the current USP Guaifenesin monograph2 as the starting point, and Fusion QbD® software for the DOE study to explore the MODR.
4.1. Chromatography Optimization
Some of the official USP monographs for guaifenesin drug products3-5 include resolution between guaifenesin and benzoic acid in system suitability evaluation. Even though benzoic acid or sodium benzoate is not listed as an inactive ingredient in the Guaifenesin Extended-Release Tablets samples procured for this work, it was decided to include benzoic acid in method development to ensure its separation from the guaifenesin and specified impurity peaks.
Five variables, including pH of mobile phase, pump flow rate, column temperature, initial hold time, and gradient time, were studied with DOE (Table 1). Constant parameters included detection wavelength of 276 nm and a gradient of 20% to 50% ACN, which are consistent with the USP Guaifenesin monograph. The software generated 33 runs for the design, with randomization and replicates considered. The injected solution contained 2 mg/mL of guaifenesin, and 0.1 mg/mL (5%) each of isoguaifenesin, guaiacol, guaifenesin dimer, dianisylglycerol, and benzoic acid, in methanol.
| Variable | Levels/Ranges |
| Mobile phase pH | Level 1: pH 2.35 (Acetic acid and water, 5:95, v/v) Level 2: pH 2.72 (Acetic acid and water, 1:99, v/v) Level 3: pH 3.22 (Acetic acid and water, 0.1:100, v/v) |
| Initial hold time | Lower Bound: 1 min Upper Bound: 3 min |
| Gradient time | Lower Bound: 16 min Upper Bound: 26 min |
| Pump flow rate | Level 1: 0.4 mL/min Level 2: 0.5 mL/min Level 3: 0.6 mL/min |
| Column temperature | Level 1: 22 °C Level 2: 27 °C Level 3: 32 °C |
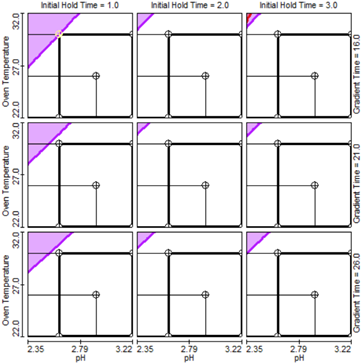
The chromatographic results from the designed studies were imported into the software for data modeling, analysis, and visualization to guide the selection of method conditions which provide best selectivity and robustness. In-silico robustness study was performed by the software with theoretical Monte Carlo simulations using the DOE-derived models. The unshaded areas in Figure 3 represent the MODR, within which the method is predicted to be robust by meeting all response goals, including sufficient peak resolution (NLT 2.0 between guaifenesin and adjacent peaks; NLT 1.5 between other peaks) and retention of the first-eluting peak (NLT 2.5 min). The areas within the rectangles (pH 2.6 – 3.2, column temperature 22° C– 30° C, initial hold time 1.0 – 3.0 min, gradient time 16 – 26 min, under flow rate of 0.5 mL/min) include method conditions that can each be independently adjusted while still meeting response goals according to model prediction. The proposed final method was chosen as 0.5 mL/min flow rate, pH 2.72 for Mobile phase A (achieved by acetic acid and water, 1:99, v/v), 25° C column temperature, 2.0 min initial hold, and 18 min gradient time, which sits near the center of the MODR. Change of method conditions in the future to another point within the MODR is warranted upon experimental validation.
4.2. Robustness
The Robustness solution, consisting of 2 mg/mL of guaifenesin, and 0.02 mg/mL (1%) each of isoguaifenesin, guaiacol, guaifenesin dimer, dianisylglycerol, and benzoic acid, in methanol, was analyzed under the proposed variable LC conditions. The changes included flow rate ±10% (0.45 mL/min and 0.55 mL/min), column temperature ±3° C(22° C and 28° C), initial isocratic hold time ±0.5 min (1.5 min and 2.5 min), gradient time ±1.5 min (16.5 min and 19.5 min) which is approximately equivalent to ±2% absolute change in the mobile phase component. Resolution criteria of NLT 2.0 between guaifenesin and adjacent peaks and NLT 1.5 between other peaks were met across all evaluated conditions.
The experimental results from the robustness study were also compared against theoretical predictions from the models generated during method optimization and confirmed the accuracy of the model.
4.3. Forced Degradation
Forced degradation studies were performed by exposing USP Guaifenesin Reference Standard to acid, base, oxidation, heat, heat/humidity, and light. The stressed samples were analyzed. The chromatograms were processed at 276 nm to detect the degradation impurities of guaifenesin. PDA data from 240–400 nm showed homogeneity of the UV spectrum for the guaifenesin peak, indicating absence of coelution.
| Condition | Medium | Total Impurities in % Area | Major Degradant in % Area (RRT/Name of Impurity) |
| Control | Unstressed | 0.5 | NA |
| Acidic | 0.1 N HCl for 3 days | 0.5 | NA |
| Basic | 0.1 N NaOH for 3 days | 0.5 | NA |
| Oxidative | 3% H2O2 for 3 days | 0.9 | 0.3 (0.7), 0.1 (Guaiacol) |
| 0.5 mg/mL AIBN at 40° C for 3 days | 0.6 | 0.1 (1.2) | |
| Heat | 105° C for 3 days | 0.5 | NA |
| Heat/Humidity | 85° C and 85% relative humidity for 3 days | 0.5 | NA |
| Light | NLT 200 watt hours/square meter (for UV light) and NLT 1.2 million lux hours (for visible light) | 0.5 | NA |
In summary, under acid, base, heat, heat/humidity and light exposure conditions, no degradation was detected. After oxidation, minor degradation was noticed. Isoguaifenesin was observed in all solutions at about 0.5% area and believed to be a process impurity. Guaiacol, a known impurity, was observed after oxidative degradation by H2O2. All known and unknown impurity peaks were separated from each other, and no coelution was observed with the main peak.
5. Identification
Identification of guaifenesin in Guaifenesin Extended-Release Tablets was evaluated using the final HPLC conditions from the Method Development section, with PDA spectral match and chromatographic retention time match. See the Assay section for method conditions and solution preparations.
5.1 PDA Spectral Match
The validation parameters and results are summarized in Table 3, and representative UV spectra of guaifenesin from the Standard solution and Sample solution are shown in Figures 4 and 5, respectively.
| Parameter | Solutions | Results |
| Spectral Agreement | Collect PDA data from 190 to 400 nm for the Standard solution and Sample solution. | The UV spectrum of the guaifenesin peak from the Sample solution matched the spectrum of guaifenesin in the Standard solution and exhibited maxima and minima only at the same wavelengths as the Standard solution. |
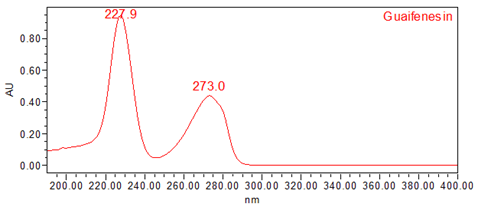
Figure 4. UV spectrum of guaifenesin from the Standard solution
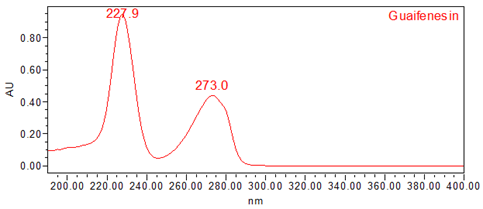
Figure 5. UV spectrum of guaifenesin from the Sample solution
5.2. Retention Time Match
The validation parameters and results are summarized in Table 4, and representative chromatograms of the Standard solution and Sample solution are shown in Figures 6 and 7, respectively.
| Parameter | Solutions | Results |
| Retention Time Match | Standard solution and Sample solution | The relative standard deviation (RSD) of the guaifenesin peak retention time for all injections of the Standard solution and Sample solution was <1.0%. |
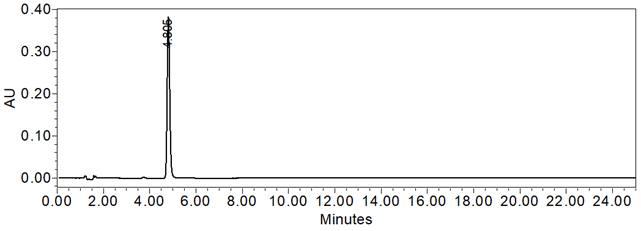
Figure 6. Chromatogram of Standard solution using the HPLC Assay procedure
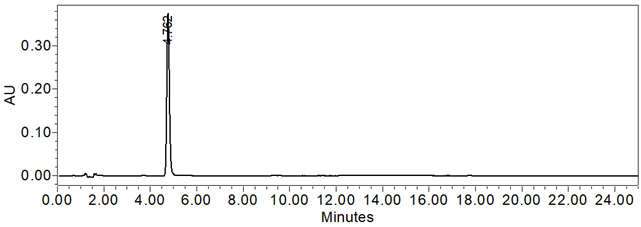
Figure 7. Chromatogram of Sample solution using the HPLC Assay procedure
6. Assay
The optimized method from the Method Development section was validated for the assay of Guaifenesin Extended-Release Tablets, using the criteria described in USP General Chapter <1225> Validation of Compendial Procedures9 and found to be specific, linear, accurate, precise for the samples evaluated.
6.1. Instruments and Method
The analysis of Guaifenesin Extended-Release Tablets was performed using Waters Alliance 2695 and Agilent 1260 instruments equipped with PDA detectors The Waters Symmetry C18, 3.0-mm x 15.0-cm, 3.5 µm column was used. The analysis was performed at 25° column oven temperature, with a flow rate of 0.5 mL/min and 5 µL as the injection volume. The autosampler was kept at ambient temperature. The PDA detector was set at 190–400 nm wavelength and the detection of chromatogram was at 276 nm. The separation was achieved by a gradient program as listed in Table 5. The results were processed using Empower (Waters software).
| Time (min) | Solution A (%) | Solution B (%) |
| 0 | 80 | 20 |
| 2 | 80 | 20 |
| 20 | 50 | 50 |
| 23 | 50 | 50 |
| 23.1 | 80 | 20 |
| 25a | 80 | 20 |
6.2. Solutions
Solution A: Transfer 10 mL of glacial acetic acid and 990 mL of water into a 1-L bottle and mix well.
Solution B: Acetonitrile.
Diluent: Methanol.
Preparation of Standard solution: A solution of 0.5 mg/mL of guaifenesin standard was prepared in Diluent.
Preparation of Sample solution: A solution with nominally 0.5 mg/mL of guaifenesin from Guaifenesin Extended-Release Tablets in Diluent was prepared as follows. Grind NLT 20 Guaifenesin Extended-Release Tablets to a fine powder. Transfer an accurately weighed portion, equivalent to about 10 mg of guaifenesin, to a 20-mL volumetric flask. Add about 16 mL of Diluent and sonicate for NLT 10 min. Dilute to volume with Diluent and mix well. Centrifuge a portion of the solution at 3750 rpm for NLT 10 min. Use the clear supernatant for analysis.
6.3. Validation Parameters and Results
The system suitability parameters and results are summarized in Table 6. The validation parameters and results are summarized in Table 7. Representative chromatograms of the Standard solution and Sample solution are shown in Figures 6 and 7, respectively.
| Parameter | Solutions | Results |
| Retention Time | Standard solution | About 4.7 min |
| Tailing Factor | Standard solution | 1.3 |
| System Precision (%RSD of 5 replicate injections) | Standard solution | 0.1 |
| Parameter | Solutions | Results |
Specificity Peak Purity Analysis | Diluent, Standard solution, and Sample solution | Any peak adjacent to the guaifenesin peak was separated from the guaifenesin peak by a resolution ≥2.0. The PDA data showed spectral homogeneity for guaifenesin and no coelution under 240 – 400 nm. |
| Linearity | Linearity solutions from 50% to 150% of the nominal concentration (0.25, 0.375, 0.50, 0.625, and 0.75 mg/mL of guaifenesin) | The correlation coefficient was ≥ 0.999. The bias of the linearity curve due to the intercept not being zero was within ±2.0%. |
| Accuracy | Accuracy solutions with 110–130% of the nominal concentration: 110% (0.55 mg/mL), n=3 120% (0.60 mg/mL), n=3 130% (0.65 mg/mL), n=3 | The average recovery at each level was within 100 ± 2.0%. |
| Repeatability | Repeatability solutions: 6 Sample solutions | The %RSD of assay results was ≤ 2.0 (n=6). |
| Intermediate Precision | 6 Sample solutions prepared and analyzed by two analysts on a different day, using a different instrument and different column serial number | The %RSD of assay results was ≤ 2.0 (n=6). The %RSD of assay results was ≤ 3.0 for the combined data of the first and second analysts (n =12). |
| Solution Stability | Standard solution and Sample solution | Stable for 24 hours at ambient autosampler temperature. |
| Sample Assay Test | Sample solution | 100.7%, 99.3%, 99.2%, and 98.8% for the four sources of drug product tested. |
a Next injection delay of 3.0 min was used on the Waters Alliance 2695 system for improved injection precision, suggesting longer post-gradient equilibration time may be needed depending on system.
7. Organic Impurities
The optimized method from the Method Development section was validated for the OI procedure, using the criteria described in <1225>9 and found to be specific, linear, accurate, precise, and free from interferences for the samples evaluated.
7.1. Instruments and Method
The analysis of Guaifenesin Extended-Release Tablets was performed using the same instruments and method as described in the Assay section, except that the detection of chromatogram was at UV 276 nm without a need for 3D PDA spectra.
7.2. Solutions
Prepare Solution A, Solution B, and Diluent as per the Assay procedure.
Preparation of individual Stock solutions: Individual Stock solutions consisting of 0.1 mg/mL of guaiacol, or 0.4 mg/mL of guaifenesin, isoguaifenesin, guaifenesin dimer, or dianisylglycerol, were individually prepared by dissolving appropriate amounts of each standard in Diluent.
Preparation of System suitability solution: A solution consisting of 2.0 mg/mL of guaifenesin and 0.01 mg/mL (0.5%) of isoguaifenesin was prepared by combining an appropriate amount of guaifenesin standard with an appropriate volume of the Stock solution for isoguaifenesin in Diluent.
Preparation of Standard solution: A solution consisting of 30 μg/mL (1.5%) of isoguaifenesin, 0.6 µg/mL (0.03%) of guaiacol, and 4 μg/mL (0.2%) each of guaifenesin, guaifenesin dimer and dianisylglycerol, was prepared by combining appropriate volumes from the individual Stock solutions in Diluent.
Preparation of Sensitivity solution: A solution consisting of 0.6 μg/mL (0.03%) of guaifenesin and 0.3 μg/mL (0.015%) of guaiacol was prepared by combining appropriate volumes from the individual Stock solutions in Diluent.
Preparation of Sample solution: A solution with nominally 2.0 mg/mL of guaifenesin from Guaifenesin Extended-Release Tablets in Diluent was prepared as follows. Grind NLT 20 Guaifenesin Extended-Release Tablets to a fine powder. Transfer an accurately weighed portion, equivalent to about 40 mg of guaifenesin, to a 20-mL volumetric flask. Add about 16 mL of Diluent and sonicate for NLT 10 min. Dilute to volume with Diluent and mix well. Centrifuge a portion of the solution at 3750 rpm for NLT 10 min. Use the clear supernatant for analysis.
7.3. Validation Parameters and Results
The system suitability parameters and results are summarized in Table 8. The validation parameters and results are summarized in Table 9. Representative chromatograms of Diluent, System suitability solution, Sensitivity solution, Standard solution, Sample solution, and Sample solution spiked with impurities at LOQ levels, are presented in Figures 8–14, respectively. Linearity was established for guaifenesin and related impurities, whereas accuracy and repeatability were established for guaifenesin related impurities.
The limit of quantitation (LOQ) was established at 0.015% (for guaiacol), 0.05% (for guaifenesin dimer, and dianisylglycerol), and 0.25% (for isoguaifenesin), with respect to the sample concentration of 2.0 mg/mL. LOQ levels were selected considering potential specification limits, and experimentally validated to meet signal-to-noise, accuracy, and repeatability criteria.
| Parameter | Solutions | Results |
|---|---|---|
| Resolution between Isoguaifenesin And Guaifenesin | System suitability solution | 4.8 (See Figure 9) |
USP Signal-to-Noise Ratio Guaifenesin |
Sensitivity solution |
18 |
| Retention Time of Guaifenesin |
Standard solution | About 4.7 min |
Relative Retention Time Isoguaifenesin |
Standard solution |
0.80 |
System Precision Isoguaifenesin |
Standard solution |
0.4 |
| Parameter | Solutions | Results |
|---|---|---|
| Specificity | Blank (Diluent), Sample solution, and spiked Sample solution | No interference with peaks of interest. Any peak ≥0.1% total area was separated from the main peak by a resolution of ≥2.0, and from adjacent related impurity peaks by a resolution of ≥1.5. |
LOQ Isoguaifenesin (0.25%) | Sensitivity solution and accuracy solutions spiked with impurities at the LOQ level. | Met signal-to-noise criterion of ≥ 10 (see Table 8). See below for accuracy and repeatability. |
| Linearity | Linearity solutions Isoguaifenesin (0.25% - 3.0%) | The correlation coefficients of the linear curves for guaifenesin and the impurities were ≥0.99. |
| Relative Response Factor (RRF) Values | Linearity solutions | See Table 10. |
| Accuracy | Accuracy solutions: Sample solution spiked with impurities at LOQ level: n=3 Standard solution level: n=6 Higher end of Linearity solutions level: n=3 | The average recovery for each impurity at 0.015%, 0.03%, and 0.05% levels: within 100 ± 20.0% 0.2% and 0.25% levels: within 100 ±10.0% 1.0%, 1.5%, and 3.0% levels: within 100 ± 5.0% |
| Repeatability | Repeatability solutions: 6 Sample solutions spiked at the Standard solution level | RSD of the 6 recoveries at 0.03% level: ≤ 10.0%; 0.2% level: ≤ 5.0%; 1.5% level: ≤ 2.5%. |
| Intermediate Precision | Repeatability solutions: 6 Sample solutions spiked at the Standard solution level prepared and analyzed by a different analyst on a different day, using a different instrument and different column serial number | The average recovery for each impurity at RSD of the 6 and 12 (combining values from the two analysts) recoveries at |
| Solution Stability | Standard solution and Sample solution spiked at the Standard solution level. Freshly prepared samples analyzed (t=0). The samples were then stored at ambient temperature and analyzed periodically for at least 24 hours. | Observed changes in the peak area for guaifenesin and each impurity from both solutions were within ± 10% from the initial time point values. |
| Sample OI Test | Sample solution | About 0.3% w/w of isoguaifenesin was observed in two of the four samples, and no other impurity above 0.1% w/w was observed in any of the four samples. See Figure 12. |
b Evaluated to determine relative response factors and to demonstrate linearity of guaifenesin at low levels in support of quantitation of potential unknown impurity peaks against the guaifenesin peak.
| Impurity Name | RRF |
|---|---|
| Isoguaifenesin | 0.93 |
| Guaiacol | 1.71 |
| Guaifenesin dimer | 1.03 |
| Dianisylglycerol | 1.36 |
RRF values of the impurities were calculated by dividing the slope of the linearity curve for each impurity by the slope of the linearity curve for guaifenesin.
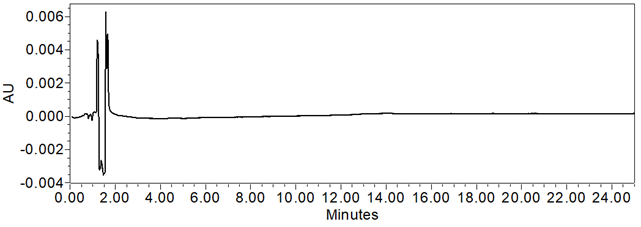
Figure 8. Chromatogram of Diluent (blank).
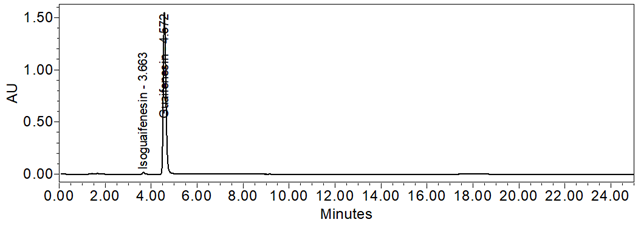
Figure 9. Chromatogram of System suitability solution.
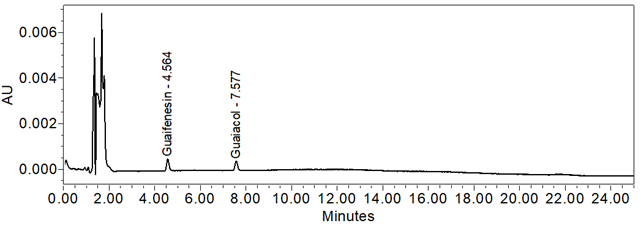
Figure 10. Chromatogram of Sensitivity solution.
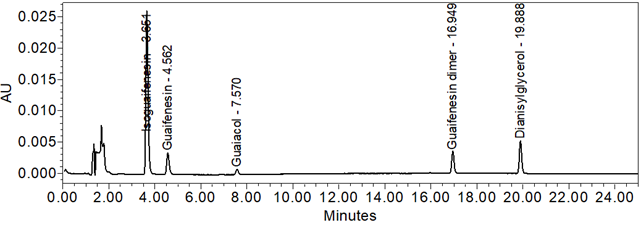
Figure 11. Chromatogram of Standard solution.
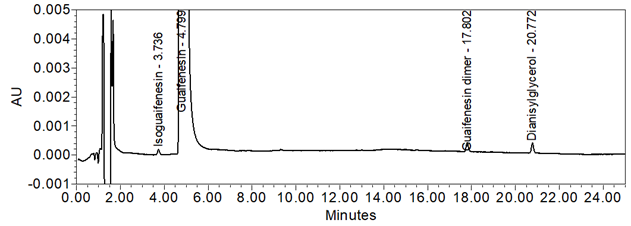
Figure 12. Chromatogram (at expanded scale) of Sample solution.
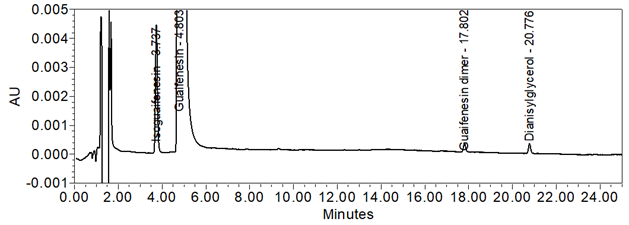
Figure 13. Chromatogram (at expanded scale) of Sample solution spiked with isoguaifenesin at the LOQ level.
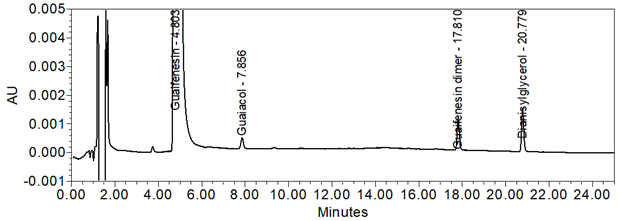
Figure 14. Chromatogram (at expanded scale) of Sample solution spiked with guaiacol, guaifenesin dimer, and dianisylglycerol, at the LOQ levels.
Comment On [Methods for the Analysis of Guaifenesin Extended-Release Tablets]
Comment On [Methods for the Analysis of Guaifenesin Extended-Release Tablets]
Submitted on version:
Comment On [Methods for the Analysis of Guaifenesin Extended-Release Tablets]
Submitted on version: