Document Type
Emerging StandardPublished date
05/15/2023Input Close Date
To be determinedScientific Experts
Dom Vicchio (Sr. Director, USP)
Introduction
To jump‐start the standard development process and have earlier stakeholder engagement, USP is piloting a new approach for developing and sharing information with our stakeholders. Through a collaboration between USP’s Small Molecules Department and the Global Analytical Development Laboratory, methods will be developed and validated for drug substances and drug products for which no monographs are currently available. The Emerging Standards are intended to improve USP’s official standards elaboration process by increasing transparency and allowing for broader stakeholder participation by publishing on the USP website prior to formal notice and comment through publication in the Pharmacopeial Forum.
Pregabalin Oral Solution has been evaluated and shown to be a suitable candidate for development under this new program. The methods, in this document, are being published to help analyze Pregabalin Oral Solution as a part of USP’s mission to improve global health through public standards that help ensure the safety, quality, and benefit of medicines and foods.
Certain commercial equipment, instruments, or materials may be identified in this document to specify adequately the experimental procedure. Such identification does not imply approval, endorsement, or certification by USP of a particular brand or product, nor does it imply that the equipment, instrument, or material is necessarily the best available for the purpose or that any other brand or product was judged to be unsatisfactory or inadequate.
This document is not a USP compendial standard and is intended to serve as a resource for informational purposes only. It does not reflect USP or USP’s Expert Body opinions of future revisions to the official text of the USP‐NF. Parties relying on the information in this document bear independent responsibility for awareness of, and compliance with, any applicable federal, state, or local laws and requirements.
Background
Pregabalin is in a class of medications called anticonvulsants. Pregabalin is the active ingredient in Pregabalin Oral Solution and Tablets. It works by decreasing the number of pain signals that are sent out by damaged nerves in the body. Pregabalin is also used to relieve neuropathic pain that can occur after a spinal cord injury, treat fibromyalgia, and if used along with other medications to treat certain types of seizures.1
The USP‐NF has a drug substance monograph for Pregabalin but does not contain a drug product monograph for Pregabalin Oral Solution. It was decided that USP should consider developing methods for Pregabalin drug products as part of the emerging standards initiative.
This document describes methods and includes supporting chromatographic systems data for peak retention time match, which may be suitable for identifying pregabalin in the presence of various impurities and excipients. High‐performance liquid chromatography (HPLC) methods and supporting validation data, which may be suitable for determining strength and purity, are also described.
Pregabalin and related compounds are shown in Figures 1 and 2.
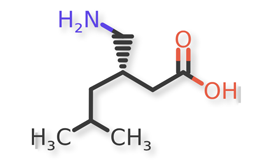
Figure 1. Pregabalin
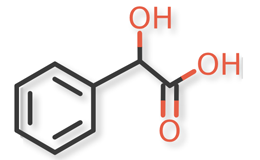
Figure 2a. Mandelic acid / 2‐Hydroxy‐2‐phenylacetic acid
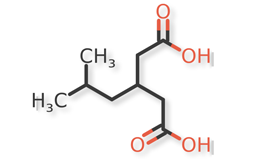
Figure 2b. Isobutylglutaric acid / 3-isobutylpentanedioic acid
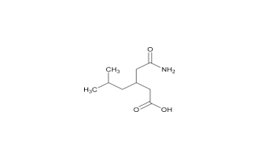
Figure 2c. Isobutylglutarmonoamide / 3‐(2‐Amino‐2‐oxoethyl)‐5‐methylhexanoic acid
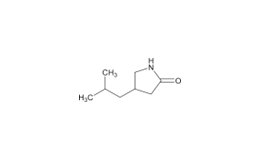
Figure 2d. Pregabalin RC C / 4-Isobutylpyrrolidin-2-one
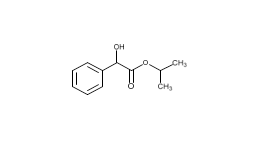
Figure 2e. Isopropyl Mandelate / Isopropyl 2‐hydroxy‐2‐phenylacetate
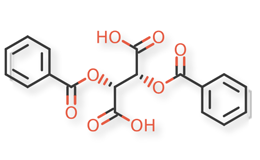
Figure 2f. Dibenzoyl‐L‐Tartaric Acid
EXPERIMENTAL
Materials:
Pregabalin Oral Solution and related compounds (isobutylglutaric acid, isobutylglutarmonoamide, , isopropyl mandelate, and dibenzoyl‐L‐tartaric acid) were procured from different suppliers. USP Reference Standards were available for pregabalin, pregabalin related compound C, and mandelic acid.
Pregabalin Oral Solution from three commercial sources were used to evaluate identification by ultraviolet (UV) spectral match and retention time match, assay, and organic impurities using methods described in this document.
IDENTIFICATION
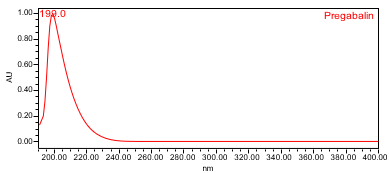
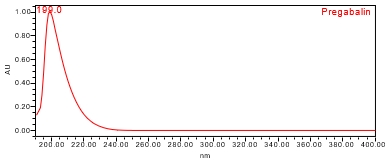
Identification (ID) of pregabalin in Pregabalin Oral Solution was evaluated using HPLC‐UV with (PDA) detector and chromatographic HPLC retention time match. However, since UV spectrum of pregabalin does not contain any maximum at the wavelengths above 200 nm, the ID by spectral match, as obtained in Assay, may not be suitable but is shown below for information only.
A. HPLC‐UV with PDA Detector:
The HPLC assay procedure with PDA detector was used as the chromatographic identification procedure. See the Assay section for the method conditions and solution preparations. The validation parameter and results are summarized in Table 1 and UV spectra of the pregabalin standard, and sample are shown in Figures 3 and 4.
| Parameter | Samples and Procedure | Results |
|---|---|---|
| Spectral Agreement | Collect PDA data from 190–400nm for the Standard solution and Sample solution | The UV spectrum of the pregabalin peak from the Sample solution matched the spectrum of pregabalin in the Standard solution and exhibited maximum only at the same wavelength (199 nm) as the Standard solution. No maxima and minima (>200 nm) were exhibited; ID by UV spectral match may not be suitable. |
| Abbreviation: PDA, Photodiode array; UV, ultraviolet | ||
B. Retention Time Match:
The chromatographic retention time is used as an identification method. The HPLC assay procedure was utilized for this identification test. Refer to the Assay section for the method conditions and solution preparations.
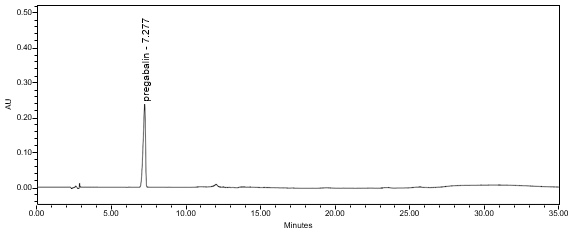
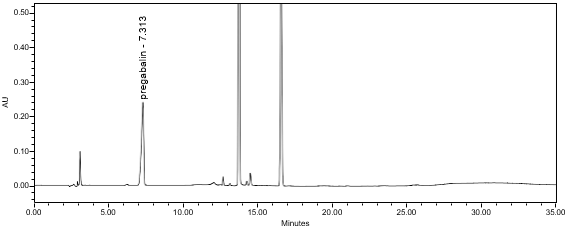
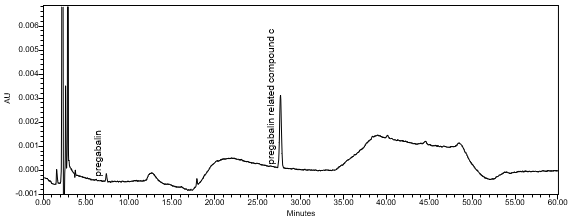
The validation parameter and results are summarized in Table 2, and the example chromatograms for the Standard solution and Sample solution are shown in Figures 5 and 6, respectively.
| Parameter | Samples | Results |
|---|---|---|
| Retention Time Match | Standard solution and Sample solution | The relative standard deviation (%RSD) of the pregabalin peak retention time for all injections of the Standard solution and Sample solution was <1.0%. |
ASSAY
A gradient reversed‐phase HPLC procedure was developed for the assay and organic impurity analyses of Pregabalin Oral Solution. The procedure was validated using the criteria described in USP General Chapter
<1225>, Validation of Compendial Procedures2 and found to be specific, linear, accurate, precise, robust, and free from interference for the samples evaluated.
Chemicals:
Ammonium phosphate dibasic (HPLC grade) was obtained from Acros Organics. Optima LC/MS grade acetonitrile and methanol, and HPLC grade orthophosphoric acid were obtained from Fisher Scientific. Ultrapure water used for HPLC analysis was obtained from a Milli‐Q water purification system.
Instruments and method:
The analysis of pregabalin was performed using Waters Alliance e2695 with 2998 PDA detector and Agilent 1260 Infinity II with G4212‐60008 DAD detector, and the results were processed by Empower (Waters software). The GL Sciences Inertsil ODS‐3V C18, 4.6‐mm x 25.0‐cm, 5 µm column was used for analysis. The analysis was performed at 50°C, with a flow rate of 1.0 mL/min and 40 µL as the injection volume. Autosampler temperature was kept at ambient. The PDA detector was set at 190‐400 nm wavelength and the detection of chromatogram was at 215 nm. Separation was achieved by a gradient program as listed in Table 3.
| Time (min) | Mobile phase A (%) | Mobile phase B (%) | Mobile phase C (%) |
|---|---|---|---|
| 0 | 82 | 16 | 2 |
| 7 | 82 | 16 | 2 |
| 10 | 40 | 16 | 44 |
| 22 | 40 | 16 | 44 |
| 23 | 82 | 16 | 2 |
| 35 | 82 | 16 | 2 |
Solutions:
Mobile phase A: Weigh and transfer about 10.56 g of ammonium phosphate dibasic into 2 L of water. Adjust to pH 6.50 ± 0.05 with orthophosphoric acid. Filter the solution through a 0.2‐µm membrane filter.
Mobile phase B: Methanol.
Mobile phase C: Acetonitrile.
Diluent: Pipet 1.0 mL of orthophosphoric acid to a 10‐mL volumetric flask and dilute to volume with water. Transfer 2.5 mL of this solution to a 250‐mL volumetric flask and dilute to volume with water.
Preparation of System suitability solution:
System suitability solution containing 5 mg/mL of USP Pregabalin RS and 25 µg/mL of Isobutylglutaric acid in Diluent.
Preparation of Standard solution:
Standard solution containing 5 mg/mL of pregabalin standard was prepared using Diluent.
Preparation of Sample solution:
Nominally 5 mg/mL of pregabalin from Pregabalin Oral Solution was prepared as follows. Pipet a volume, equivalent to about 50 mg of pregabalin, to a 10‐mL volumetric flask. Dilute to volume with Diluent and mix.
Analytical parameters and validation:
The optimized chromatographic conditions were checked for robustness and validated by evaluating specificity, linearity, precision, and accuracy as described in <1225>.2 The system suitability requirements are summarized in Table 4. The validation parameters, solutions, and results for Pregabalin Oral Solution are summarized in Table 5. The example chromatograms for the assay Standard solution and Sample solution are shown in Figures 5 and 6, respectively.
| Parameter | Solutions | Results |
|---|---|---|
| Retention time | Standard solution | About 7.3 min |
| Tailing factor | Standard solution | Tailing was NMT 2.0 |
| System Precision (for 5 replicate injections) | Standard solution | %RSD was NMT 0.5 |
| Resolution | System suitability solution | NLT 1.5 |
| Abbreviation: RSD, relative standard deviation; NMT, not more than; NLT, not less than | ||
| Parameter | Solutions | Results |
|---|---|---|
Specificity (Chromatographic Separation)
Peak Purity Analysis (Spectral Homogeneity) | Diluent, Standard solution, and Sample solution | Any impurity peak from the Standard solution and Sample solution was separated from the pregabalin peak by a resolution ≥1.5. The PDA data from 200–240 nm showed homogeneity of UV spectrum for the pregabalin peak, indicating the lack of coelution. |
| Identification | Standard solution and Sample solutions | The %RSD for pregabalin peak retention time from all injections of Standard solution and Sample solutions was NMT 1.0. |
| Linearity | Linearity solutions from 50% to 150% of the nominal concentration (2.5, 3.75, 5.0, 6.25, and 7.5 mg/mL of pregabalin) | The correlation coefficient (r) was not less than 0.999. The bias of the linearity curve due to the intercept not being zero was less than ± 2.0%. |
| Accuracy | Accuracy solutions from 110–130% of the nominal concentration were prepared in triplicate: 110% (5.5 mg/mL), n=3 120% (6.0 mg/mL), n=3 130% (6.5 mg/mL), n=3 | The average recovery at each level was within 100 ± 3.0%. |
| Repeatability | Repeatability solutions: 6 Sample solutions | The %RSD was NMT 2.0 (n=6). |
| Intermediate Precision | Intermediate precision was done by a different analyst, on a different day by using a different instrument and different column lot number. | The %RSD was NMT 2.0 (n=6). The %RSD was NMT 3.0 for the combined data of the first and second analysts (n=12). |
| Solution Stability | Standard solution and Sample solution | Standard solution and Sample solution were stable for 24 hours at ambient temperature. |
| Sample Assay Test | Sample solution | Sample 1: 101.8% Sample 2: 98.6% Sample 3: 98.4% |
ORGANIC IMPURITIES
The HPLC method used for the analysis of the organic impurities is the same procedure as described in the Assay section, except for modifications made to the HPLC gradient program as summarized in Table 6. The method can be used to quantitate degradants in Pregabalin Oral Solution. The procedure was validated using the criteria described in <1225>2 and found to be specific, accurate, precise, robust, linear, and free from interference for the samples evaluated. The validation study showed that the method is suitable for the evaluation of the organic impurities in Pregabalin Oral Solution drug product.
| Time (min) | Mobile phase A (%) | Mobile phase B (%) | Mobile phase C (%) |
|---|---|---|---|
| 0 | 82 | 16 | 2 |
| 7 | 82 | 16 | 2 |
| 16 | 64 | 18 | 18 |
| 30 | 64 | 18 | 18 |
| 35 | 57 | 18 | 25 |
| 45 | 57 | 18 | 25 |
| 50 | 82 | 16 | 2 |
| 60 | 82 | 16 | 2 |
Solutions:
Prepare Mobile phase A, Mobile phase B, Mobile phase C, and Diluent and follow chromatographic conditions per the assay procedure with gradient program in Table 6.
Preparation of Isobutylglutaric acid stock solution:
Isobutylglutaric acid stock solution consisting of 0.10 mg/mL was prepared by dissolving the appropriate amount of impurity in Diluent with the aid of sonication.
Preparation of System suitability solution:
A solution consisting of 5.0 mg/mL of Pregabalin standard and 0.025 mg/mL of Isobutylglutaric acid was prepared by combining an appropriate amount of Pregabalin standard with an appropriate volume of Isobutylglutaric acid stock solution in Diluent. Sonicated to dissolve.
Preparation of Standard stock solution 1:
Standard stock solution 1, containing 0.1 mg/mL each of Pregabalin standard and pregabalin related compound C standard, was prepared by combining an appropriate amount each of Pregabalin standard and pregabalin related compound C standard in Diluent. Sonicated to dissolve.
Preparation of Standard stock solution 2:
Standard stock solution 2, containing 0.05 mg/mL each of Pregabalin standard and pregabalin related compound C standard, was prepared from the Standard stock solution 1 by further diluting with the Diluent.
Preparation of Standard solution (Sensitivity solution):
Standard solution, containing 0.005 mg/mL each of Pregabalin standard and pregabalin related compound C standard, was prepared from the Standard stock solution 2 by further diluting with the Diluent. Solution is also used as Sensitivity solution.
Preparation of Sample solution:
Nominally 5 mg/mL of pregabalin from Pregabalin Oral Solution was prepared as follows. Pipet a volume, equivalent to about 50 mg of pregabalin, to a 10‐mL volumetric flask. Dilute to volume with Diluent and mix.
Analytical parameters and validation:
The optimized chromatographic conditions were checked for robustness and validated by evaluating specificity, linearity, accuracy, repeatability, intermediate precision as described in USP General Chapter <1225>.2 Linearity was established for pregabalin and pregabalin related compound C, whereas accuracy and repeatability were established for pregabalin related compound C.
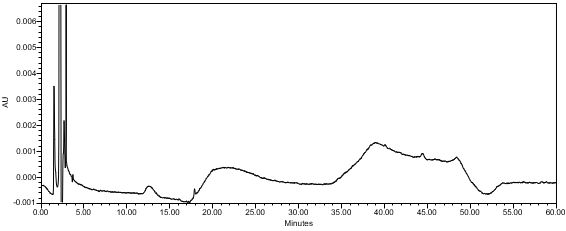
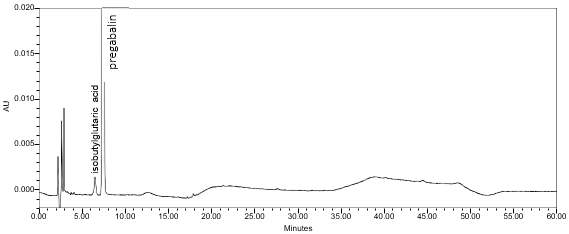
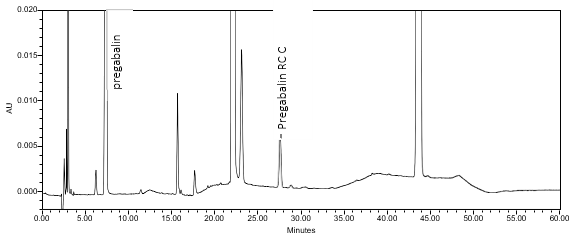
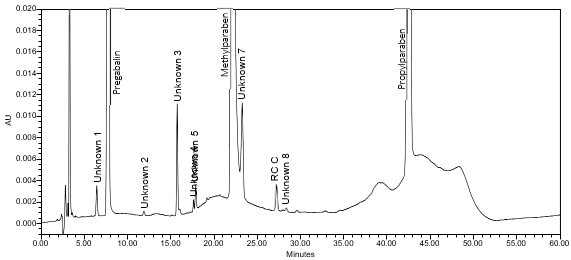
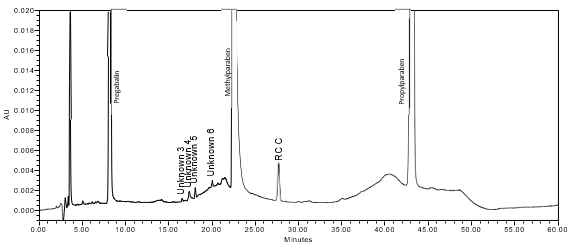
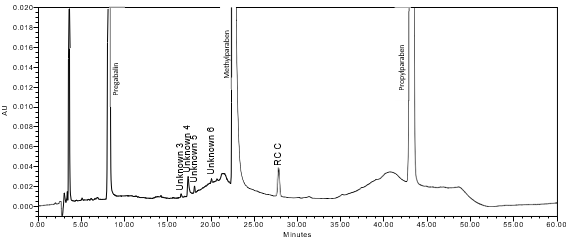
The limit of quantitation (LOQ) was established at 0.10% of sample concentration. The system suitability requirements are summarized in Table 7. The validation parameters and testing results for Pregabalin Oral Solution are summarized in Table 8. The example chromatograms of Diluent, Standard solution (Sensitivity solution), System suitability solution, Sample solution, and Sample solution with spiked pregabalin related compound C (LOQ) are presented in Figures 7–10, respectively.
| Parameter | Solution | Results |
|---|---|---|
Resolution Minimum resolution between pregabalin | System suitability solution | NLT 3.1 (See Figure 9) |
Relative Retention Time(s) Pregabalin | Sensitivity solution | 1.0 3.8 (See Figure 8) |
System Precision Pregabalin | Sensitivity solution |
4.7 |
USP Signal‐to‐Noise Ratio Pregabalin | Sensitivity solution |
NLT 14 |
| Parameter | Solutions | Results |
|---|---|---|
| Specificity | Blank (Diluent), Sample solutions, and Spiked solutions | No interference between peaks of interest. Any impurity peak ≥0.1% total area was separated from the pregabalin and pregabalin related compound C peaks by a resolution of ≥ 1.5. |
Linearity Pregabalin | Linearity solutions from LOQ (0.1%) to 1.2% of the nominal concentration (5, 12.5, 25, 37.5, 50, and 60 µg/mL) in Diluent | The correlation coefficient of the linear curves for pregabalin and pregabalin related compound C were not less than 0.99. |
| Relative Response Factor (RRF) Values | Linearity solutions From LOQ (0.1%) to 1.2% of the nominal concentration of pregabalin and pregabalin related compound C in Diluent | For results, refer to Table 9. |
Accuracy Pregabalin Related Compound C | Accuracy solutions: pregabalin related compound C spiked in Sample solution at 3 levels: LOQ (0.1%): n=6 | The average recovery for pregabalin related compound C at each level were observed to be within: 0.1%: 100 ± 20.0% 0.5%: 100 ±10.0% 1.0%: 100 ± 5.0% |
Repeatability Pregabalin Related Compound C | Repeatability solutions: 6 spiked Sample solutions at the LOQ level | The %RSD of the recovery was ≤ 10.0% (n=6). See Figure 10 for example chromatogram. |
Intermediate Precision Pregabalin Related Compound C | Repeatability solutions: 6 spiked Sample solutions at the LOQ level prepared and evaluated by a different analyst on a different day, using a different instrument and different column lot number | The average recovery at LOQ was within 100 ± 20.0%. %RSD of the 6 results at LOQ was ≤ 10.0%. %RSD of the 12 results (analyst 1 and 2) at LOQ was ≤ 15.0%. |
| Sample Analysis | Sample solution | See Figure 11. |
Solution Stability Pregabalin | Sensitivity solution and spiked Sample solution at LOQ level. Freshly prepared samples analyzed (t=0) periodically for up to 24 hours at ambient temperature. | Peak area changes of pregabalin (in Sensitivity solution only) and pregabalin related compound C peaks (in both solutions) were within ±10% from the initial time point values. |
| Impurity Name | RRF |
|---|---|
| Pregabalin related compound C | 16.68 |
| Pregabalin | 1.00 |
RRF value of pregabalin related compound C was calculated by dividing the slope of the linearity curve for pregabalin related compound C by the slope of the linearity curve for pregabalin.
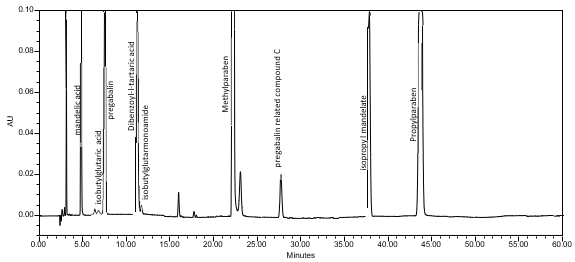
Robustness Study
A Robustness solution A, containing 5.0 mg/mL of pregabalin from Pregabalin Oral Solution and 0.025 mg/mL each of related compounds (mandelic acid, isobutylglutaric acid, dibenzoyl‐l‐tartaric acid, isobutylglutarmonoamide, pregabalin related compound C, and isopropyl mandelate) in Diluent, was analyzed by HPLC and subjected to small but deliberate changes in chromatographic conditions including flow rate ± 10%, column temperature ± 3°, buffer concentration ± 10%, buffer pH ± 0.2, isocratic hold time ± 0.5 min, gradient profile ± 2%, and detection wavelength ± 2.0 nm. It was shown that the retention time of isobutylglutaric acid peak was sensitive to pH change, thus, a tight control of buffer pH (6.5 ± 0.05) will be required to ensure a baseline resolution from the pregabalin peak. Additionally, an increase in buffer concentration was shown to decrease the resolution between related compounds dibenzoyl‐l‐tartaric acid and isobutylglutarmonoamide. Other robustness conditions evaluated met system suitability target criteria for resolution and tailing factor showing little to no change.
A Robustness solution B (Sensitivity solution), containing 5 µg/mL each of pregabalin standard and isobutylglutaric acid in Diluent, was analyzed by HPLC and subjected to small but deliberate changes in chromatographic conditions including flow rate ± 10%, column temperature ± 3°, buffer concentration ± 10%, buffer pH ± 0.2, and detection wavelength ± 2.0 nm. The robustness conditions evaluated met system suitability target criteria for signal‐to‐noise ratio (NLT 10) showing little to no change.
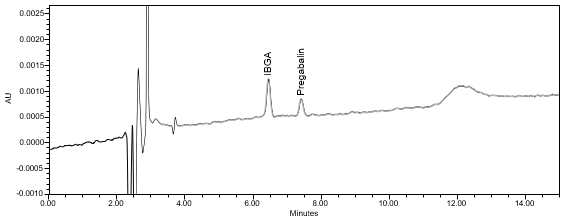
Forced Degradation Study
A forced degradation study was performed by exposing USP Pregabalin RS to acid, base, oxidation, heat, heat/humidity, and light. The stressed samples were analyzed. The chromatograms were processed at 215 nm to detect the degradation impurities of pregabalin.
| Sample | Condition | Pregabalin %w/w | Pregabalin %TDA | Pregabalin RC C %TDA |
|---|---|---|---|---|
| Control | Freshly prepared | - | 100.0% | - |
| Unstressed | Aged for 3 days | 98.9% | 100.0% | - |
| Acid Stress | 0.1 N HCl for 3 days | 100.0% | 95.9% | 0.8% |
| Base Stress | 0.1 N NaOH for 3 days | 96.5% | 75.5% | 23.5% |
| Peroxide (H₂O₂) Stress | 3% H₂O₂ for 3 days | 88.1% | 77.4% | - |
| AIBN Oxidative Stress | 0.5 mg/mL AIBN for 3 days at 40° | 96.1% | 83.5% | 0.4% |
| Heat Stress | 105° for 3 days | 99.4% | 98.8% | 1.2% |
| Heat/Humidity Stress | 85° and 85% RH for 3 days | 100.0% | 100.0% | - |
| UV/VIS Stress | 600 watt hours/m² of UV light and 1.2 million lux hours of Visible light | 98.6% | 100.0% | - |
In summary, the pregabalin peak was found to be spectrally pure in control and all stressed samples except for the sample under peroxide stress condition. Purity plot showed a degradant co‐eluting at the tailing part of the pregabalin peak. The degradant was only found under peroxide stress condition at about 4% TDA after three days in 3% H2O2 solution. Other minor degradants surrounding the pregabalin peak were formed under this stress condition. Additionally, of the six related compounds, only pregabalin RC C was found to be a degradant, which could be observed most prominently under base stress condition.
Comment On [Methods for the Analysis of Pregabalin Oral Solution]
Submitted on version: